

Metrics That Matter: How to Build a KPI Dashboard
- Brand Growth
- Marketing
- PPC
- SEO
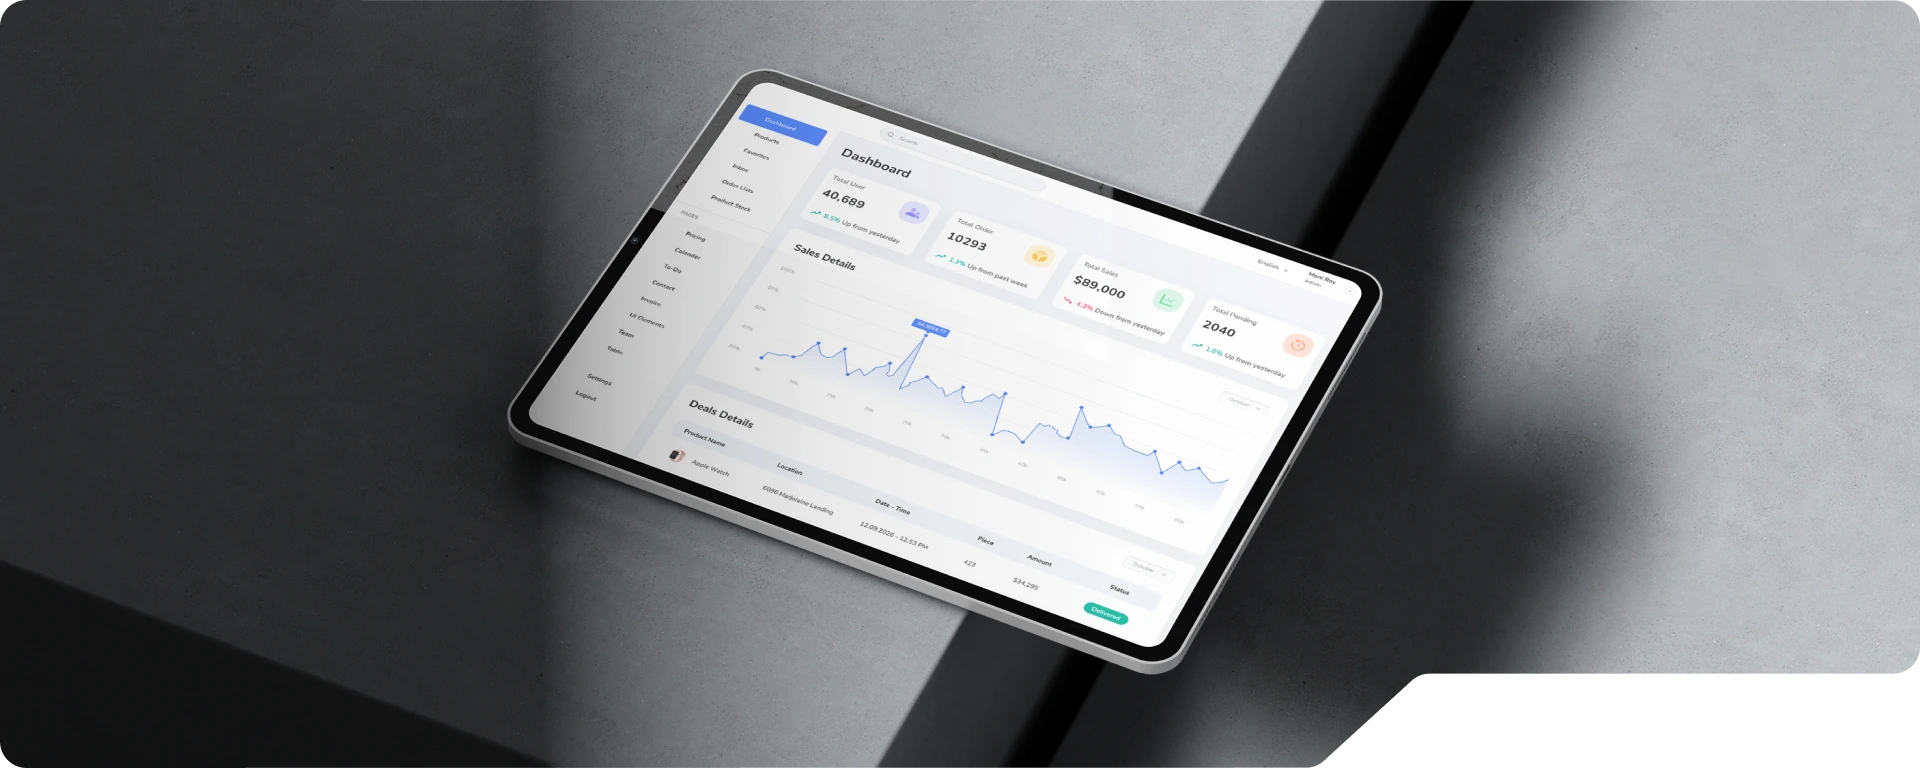
Data has never been more accessible. From website traffic and ad performance to CRM reports and customer behavior, businesses can measure almost everything.
The challenge isn’t collecting more information. It’s knowing which numbers actually deserve your attention. That’s where a well-built KPI dashboard comes in.
A KPI dashboard is a strategic asset that gives you a clear picture of your business’s health, helping you identify what’s working, where you’re falling behind, and what deserves your attention next.
At AVINTIV, we’ve partnered with more than 450 brands across industries, including manufacturing, healthcare, home services, professional services, SaaS, and e-commerce.
One lesson consistently stands out: The businesses growing the fastest aren’t tracking the most KPIs — they’re tracking the right ones.
Why Every Business Needs a KPI Dashboard
Think of your KPI dashboard as the control center for your business.
Instead of jumping between advertising platforms, analytics tools, sales reports, and spreadsheets, a dashboard brings your most important performance indicators into one place. More importantly, it helps leadership understand what those numbers actually mean.
A great dashboard creates alignment across your organization. Marketing may be generating leads, sales may be closing deals, and operations may be improving efficiency, but those departments don’t operate independently.
Every business function contributes to overall growth, and your dashboard should reflect that relationship.
More than anything, a dashboard should help you answer a simple question: Are we moving closer to our business goals?
When built strategically, KPI dashboards help businesses:
- Identify trends before they become major problems.
- Measure progress toward quarterly and annual objectives.
- Remove guesswork from strategic decision-making.
- Create accountability through measurable performance.
- Identify opportunities to optimize marketing, sales, and operations.
The value isn’t in the charts themselves. It’s in the confidence those charts give you when making important business decisions.
The Biggest Mistake Businesses Make When Building KPI Dashboards
One of the most common mistakes our strategists encounter is assuming that more data automatically creates better insight.
Modern reporting platforms make it incredibly easy to track hundreds of metrics. The problem is that businesses rarely need hundreds of metrics to make decisions.
Information overload creates hesitation.
Instead of immediately recognizing opportunities or problems, leadership teams often find themselves sorting through dashboards filled with numbers that don’t influence their next move.
We encourage clients to ask themselves, “What business decision will this metric help us make?”
If the answer isn’t obvious, it probably doesn’t belong on the dashboard.
The Right Dashboard Depends on Your Business Model (Across E-Commerce, Service, SaaS, and More)
One-size-fits-all dashboards don’t exist. After building reporting systems for hundreds of businesses, we’ve found that the most effective dashboards are determined by how a business actually generates revenue.
E-Commerce Businesses
E-commerce companies often need immediate visibility into purchasing behavior and advertising efficiency. Because transactions happen quickly, their dashboards focus heavily on customer acquisition and revenue optimization.
Key metrics often include:
- Revenue to measure overall business growth.
- Return on Ad Spend (ROAS) to evaluate advertising efficiency.
- Conversion Rate to understand how effectively traffic becomes customers.
- Average Order Value (AOV) to identify opportunities for increased revenue.
- Cart Abandonment Rate to uncover friction during checkout.
- Customer Lifetime Value (LTV) to evaluate long-term profitability.
Service-Based Businesses
Service businesses operate very differently from companies with online stores.
Whether you’re a law firm, contractor, healthcare provider, or consulting company, revenue depends on generating qualified conversations rather than immediate purchases.
That changes what belongs on the dashboard.
Instead of focusing on transactions, service businesses often prioritize:
- Qualified leads.
- Cost per lead.
- Sales pipeline value.
- Appointment booking rate.
- Close rate.
- Customer acquisition cost.
These KPIs help answer questions like: Are we attracting the right prospects? Is our marketing producing profitable opportunities? And is our sales process converting demand into revenue?
SaaS Businesses
Software companies rely on recurring revenue, making retention just as important as acquisition.
Rather than measuring one-time purchases, SaaS dashboards typically prioritize sustainable growth over time.
Important KPIs often include:
- Monthly Recurring Revenue (MRR)
- Customer Churn Rate
- Customer Lifetime Value (LTV)
- Customer Acquisition Cost (CAC)
- LTV:CAC Ratio
- Product Activation Rate
These metrics reveal whether growth is healthy, scalable, and financially sustainable.
B2B & Enterprise Organizations
Enterprise organizations usually navigate longer buying cycles, multiple stakeholders, and significantly larger contract values.
That means dashboards should emphasize pipeline health and sales efficiency rather than short-term conversion volume.
Common KPIs include:
- Sales cycle length
- Pipeline velocity
- Average deal size
- Win rate
- Marketing Qualified Leads (MQLs) versus Sales Qualified Leads (SQLs)
- Customer retention rate
The most important lesson is that your dashboard shouldn’t copy another company’s reporting. It should reflect how your business creates value.
How We Prioritize KPIs at AVINTIV
One of the biggest differences between strategic reporting and generic marketing reports is where the process begins.
Before recommending a single KPI, our strategists work to understand what success actually looks like for your organization. Only then do we determine which metrics belong on the dashboard.
Our process typically looks like this:
- Define business objectives: Every KPI should support a measurable business outcome.
- Identify revenue-driving activities. We determine which actions consistently generate growth.
- Separate leading and lagging indicators: Leading indicators predict future success, while lagging indicators confirm results.
- Remove unnecessary metrics: If a number doesn’t influence decision-making, it doesn’t belong on the dashboard.
- Design dashboards around action: Every visualization should help leadership decide what to do next, not simply report what already happened.
Because businesses evolve, dashboards should evolve too.
The KPIs that matter during rapid growth often differ from the KPIs that matter during market expansion, operational scaling, or profitability initiatives.
A Great Dashboard Should Tell a Story
The best dashboards don’t just organize numbers. They connect them.
A leadership team shouldn’t have to interpret dozens of unrelated charts to understand business performance. Instead, a dashboard should reveal how marketing, sales, customer behavior, and revenue influence one another.
When built correctly, dashboards answer questions before executives even think to ask them.
They help you understand:
- Whether your marketing investments are producing meaningful growth.
- Whether your sales pipeline supports future revenue goals.
- Whether customer acquisition remains profitable.
- Whether operational changes are improving business performance.
- Whether it’s time to double down on a successful strategy or pivot before small issues become larger problems.
That’s the difference between reporting and strategy. Reporting tells you what happened. A strategic dashboard helps determine what happens next.
Build a KPI Dashboard That Drives Better Decisions
A KPI dashboard isn’t valuable because it contains data. It’s valuable because it gives you clarity.
When every metric answers a business question, every report becomes easier to interpret, every meeting becomes more productive, and every strategic decision becomes more informed.
At AVINTIV, we’ve spent years helping businesses transform disconnected reporting into growth-focused decision-making systems.
Whether we’re partnering with a fast-growing e-commerce brand, a regional service provider, or an enterprise organization, our goal is to report on metrics that help leadership focus on what actually moves the business forward.
Connect with us today, and let’s build a reporting ecosystem that helps your business grow!

Ready
 to grow


